How To Pick An Exposure Time For Astrophotography
A regularly asked question in astrophotography is “what sub-exposure should I use?”. This is quite a large question and is difficult to answer as all our setups are different, our sky conditions aren’t the same and it can even depend on what target we’re imaging. So in this article I’m going to help you in understanding how to pick an exposure time for astrophotography.
We’ll start with why we use sub-exposures, stacking principles and then how to calculate the exposure length. Included will be some given examples, and an interactive calculator to help you find your own ideal exposures. Just a note! This guide is in no way exhaustive. It’s just a guide to get you in the right ball-park and then to experiment from there with what works for you!
With that let’s get into what a sub-exposure is, why we do sub-exposures in astrophotography and how can we calculate an optimum sub-exposure length for astrophotography.
I will warn you. There’s a lot of maths in this article. I’m going to walk you through it and make as easy as I can with plenty of examples. But if you want to just get to the good stuff, then you can just jump to the Exposure Time For Astrophotography Calculator I created.
Contents
- What Is A Sub-Exposure?
- Why Do We Need Sub-Exposures?
- How Does Light Pollution Affect Sub-Exposure Length?
- How Much Light (Pollution) Do I Capture?
- How To Pick An Exposure Time For Astrophotography
- How To Pick An Exposure Time For Astrophotography (Video)
- Exposure Time For Astrophotography Calculator
What Is A Sub-Exposure?
So what is a sub-exposure? In traditional photography, you’ll take one photo of your subject. Despite how much you may create your composition, when you take the one image, you’re done. Even in long-exposure photography you may take a photo that’s 30 seconds long, or even a minute. But you’re still taking one photo. So… why wouldn’t you do that in astrophotography?
It may be tempting to take one single exposure of your nebula or galaxy that’s two or three minutes long, perhaps ten minutes long. But in reality this could be a very bad idea. Besides the fact astrophotography is very different to terrestrial photography, the rules are different. We need very long exposure times to get the best image. By that I mean at least three hours usually. Taking one single three hour photograph is not practical.
However, we can recreate the results of a really long exposure by cutting it down into smaller sub-exposures. Then using specialist software we can stack those photos on top of each other to get a result very similar to taking one very long photo. Also sub-exposures gives us a lot more freedom and safety when imaging a Deep Sky Object (DSO). A sub-exposure, even an optimum sub-exposure length for astrophotography, are a small piece that creates something much bigger than the sum of their parts.
Why Do We Need Sub-Exposures?
Imagine it: you’re 57 minutes in to a 60 minute exposure. Then a plane flies through your frame, or your mount’s guiding has an erratic moment, or a patch of cloud floats on by. That entire exposure is now ruined. You’re not saving it. So that’s an hour wasted. Now imagine we split that 60 minute exposure up into 20 sub-exposures that are 3 minutes long each. In this scenario, the plane/cloud/guiding will ruin only one of your images. Which can be re-taken a lot easier. The end result, after stacking, is still 60 minutes total exposure. By breaking it down into sub-exposures in astrophotography, we can safeguard ourselves from uncontrollable variables whilst imaging.
On top of that as well, it gives us so much more control when imaging a target. In astrophotography, we are usually imaging targets that have a very high dynamic range. That means a massive difference between the dark areas and the bright areas of an image. The background space is usually close to black, and yet stars are very bright sources of light. If you image just one long exposure again, then you’ll over-expose the stars leaving just white blobs with no colour in them. So we can further control the colours and dynamic range by taking sub-exposures.
We need sub-exposures in astrophotography to help protect our images from these random occurrences. Heck, even if the mount loses power and the camera loses power and the laptop loses power. We still get our images. On top of that, it’s entirely possible that using sub-exposures and stacking can increase the signal-to-noise ratio of the image. That’s a fancy way of saying the image will look a lot cleaner and details will be better.
So that’s why we need sub-exposures. Which leads naturally into the question of “how to pick an exposure time for astrophotography?” Before we can answer that though we need to understand the affect other external factors have on our imaging. Namely, light pollution.
How Does Light Pollution Affect Sub-Exposure Length In Astrophotography?
A simple fact of this hobby is the majority of us are dealing with some level of light pollution. You may be photographing from the middle of a major city like London, or you may be in the absolute remote nothingness of the Australian Outback. Most of us fall somewhere in between, a smaller city or a large town with a level of light pollution.
This section is where we begin to get a bit meaty. Grab a pen and paper if you need to, there’ll be some maths involved but I’ll make it as friendly as possible!
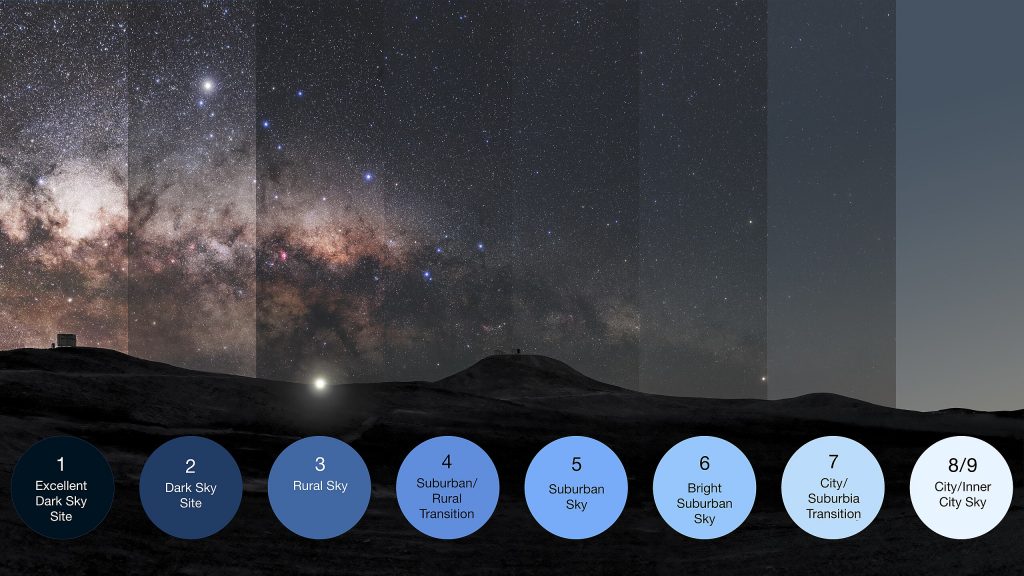
The common classification of light pollution is called the Bortle Scale and is a scoring matrix between 1 and 9. 1 being pristine dark skies and 9 being inside major cities with abundant artificial light.
| Bortle Scale | Example | Affect On Seeing |
| 1 | Excellent Dark Skies | – Zenithal Light Easily Visible & Colourful – Zodiacal Banding Visible – Unrecognisable Constellations (because there’s so many stars!) – Venus and Jupiter can break your dark vision! |
| 2 | Typical Dark Sky | – Zodiacal light is distinctly colourful – Clouds look like holes in the sky – Milky way is extremely detailed |
| 3 | Rural Sky | – Zodiacal light still looks good – A bit of light pollution on the horizon -Milky way is detailed and complex |
| 4 | Brighter Rural | – Light pollution domes are visible in multiple directions – Milky way is visible but lacks details – Clouds are illuminated in direction of the light domes |
| 5 | Sub-Urban Sky | – Zodiacal light is difficult to see – Light pollution is visible in all directions -Washed out Milky Way |
| 6 | Bright Sub-Urban Sky | – Impossible to see zodiacal light – Clouds are fairly bright – Milkyway only visible at the zenith (straight up) |
| 7 | Sub-Urban / Urban Transition | – Whole sky looks grey – Clouds are brightly lit – The Milky Way is invisible |
| 8 | City Sky | – Sky is light grey or orange – Only the brightest Messier Objects can be seen even with a telescope – M31’s core is fractured and not detailed |
| 9 | Inner-City Sky | – The sky is brilliantly lit – Only the brightest stars can be seen – Aside from the Pleiades, no other Messier objects can be seen naked eye |
As we can see from the chart, the night sky and conditions can have a massive affect on our ability to observe and photography the night sky. It is probably the single-most limiting factor that prevents us from getting the images we want. That’s not to rule out the natural light pollution – the Moon. A Full Moon can raise a Bortle 1 up to a Bortle 7! But for this example we’re going to focus purely on artificial light pollution sources like street lights.
As decided earlier, the vast majority of us probably fall somewhere between Bortle 6 and Bortle 8. For the sake of demonstration, I’m going to use my Bortle Scale which has been reported at about a 6. I can see the Milky Way when I look straight up, but it’s definitely bright here!
If you want to find your own, then try the Light Pollution Map for yourself.
How Much Light (Pollution) Do I Capture?
It stands to reason then that when we photograph the night sky from any of these areas, we will be shooting through the light pollution. That means we will inevitably capture light pollution with our cameras when we’re doing our astrophotography. There is a fantastic tool by Dr. Robin Glover of who created SharpCap to help you calculate how much light pollution you’ll absorb. My Optimum Sub-Exposure For Astrophotography Calculator is based off of this. Before I send you to that tool, let me talk you through it.
Our camera sensors basically convert photons into electrons and that then creates a voltage. It’s a very fancy way of describing it. However what you need to know is the light that hits the sensor creates a signal the camera uses to understand what it’s seeing. When a photon from the object we want to image, like a beautiful bit of nebulosity, lands on our camera. The electronics within that camera will do a lot of conversions and calculations to create the image.
The problem we have is the camera cannot distinguish between what photon is from that galaxy you’re imaging, and what photons are coming from your neighbour’s light! The camera just absorbs that light and creates our image.
Pixel Size & Quantum Efficiency
The unit we measure light pollution in is Electrons per pixel per second of our camera (e/pix/s). The bigger the pixel is, the greater affect light pollution has. This is because it’s physically bigger, and more light polluting photons can land on it. It’s like having a bigger bucket in a rainstorm. Pixel size is a double edged sword for most of us in light polluted areas! This calculation uses the sizing of the pixels, as they’re our ‘buckets’ to collect the light that’s falling.
Quantum Efficiency is a fancy way of just describing how effective your camera is at doing that conversion. If you have 10 photons hitting your sensor, we would like all 10 to be converted into signal. That would be a quantum efficiency of 100%, and that doesn’t exist. Your camera’s manufacturer will have spec sheets that will tell you what the quantum efficiency is. So if 100 photons land on your sensor, and it can turn 50 of them into a signal, then the quantum efficiency is 50%.
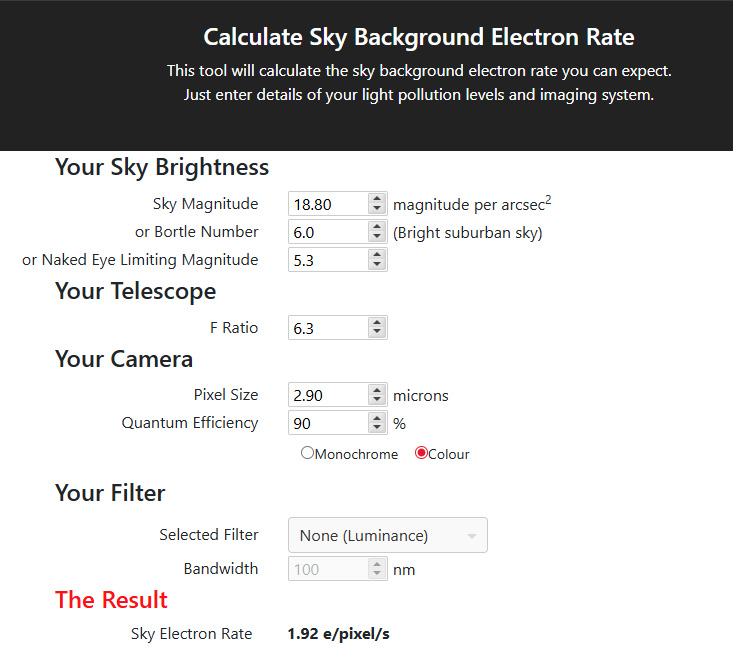
In this example we’ll use my ZWO ASI 585mc Pro and my Sky-Watcher Evostar 80ED with a 0.85x reducer.
- Bortle Rating: 6
- F Ratio: 6.3
- Pixel Size: 2.9µm
- QE: 91%
As I am using a colour camera, I don’t need to change that part. But you’ll see how the formula updates automatically for you, and you can only choose filters if you’re using a monochrome camera.
If you’re using a narrowband filter with a colour camera and you really want to know the result. Then select Monochrome, choose your filter. Then divide your Sky Electron Rate by 3.
So in this case we can see my Sky Electron Rate is 1.92 e/pixel/s and that’s what will be used going forwards.
This is from the SharpCap website, though in my Optimum Sub-Exposure For Astrophotography Calculator I’ve programmed it all in for you.
So this is saying that for every pixel on my camera, every second I’m taking an image for I’m capturing 1.92 electrons worth of light pollution. Of course filtration will affect this also, which I’ll explore more later on.
How To Pick An Exposure Time For Astrophotography
Okay let’s bring this together now and find out how to calculate the optimum sub-exposure length for astrophotography. There are some more sums involved here. I’ll include the formulae for you mathematicians, but I’ll also give you as many numbers as possible to make this accessible.
So as we’ve already covered, my skies and my telescope/camera combination means I’m sucking in 1.92e/pix/s whilst I’m imaging. We know the Bortle scale, how to find your camera specifications and its affects on our sky electron rate.
The calculation we have to do is
Read Noise
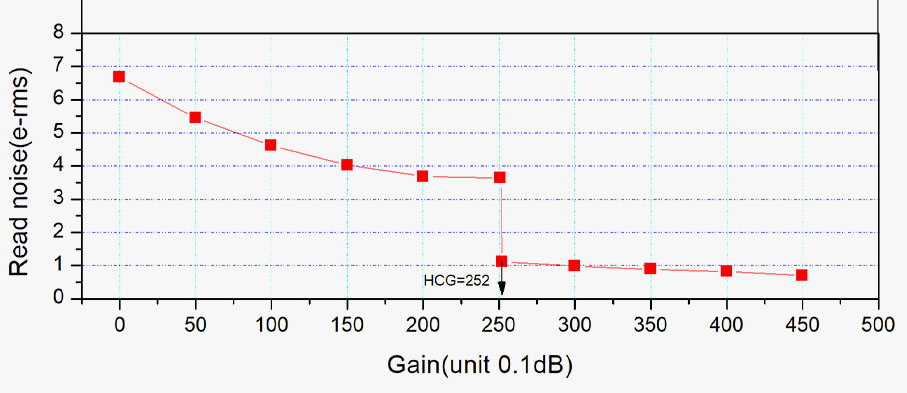
One value we need for this calculation is the read noise of our camera. The read noise is an inescapable piece of noise that we will get every single time we take a photo. It’s essentially mistakes in the circuitry of the camera. Remember how I said it converts a photon to an electron, and then into a voltage? Read noise is basically mistakes in that calculation. Every camera has it. The read noise of the image depends on what gain you’ve selected at the time you’ve taken a photo. Gain is a totally different topic I’ll cover another time.
| Read Noise | 6.6 | 5.5 | 4.7 | 4 | 3.8 | 1.1 | 1 | 0.9 | 0.8 | 0.7 |
| Gain | 0 | 50 | 100 | 150 | 200 | 250 | 300 | 350 | 400 | 450 |
On a chart it looks a little like this. Every camera manufacturer will have the specs for your camera. If not, try searching for other manufacturers that use the same sensor in them. For example the ZWO ASI 183, Altair Astro 183 and QHY183 all use the Sony 183 sensor.
The astrophotography software SharpCap can also perform a sensor analysis of your particular camera’s sensor and give you much more precise values.
For this example let’s pick a gain of 150. It gives me a read noise of 4. That’s a nice round number.
C Value
What’s that C value? Let’s get that now. It’s very mathy.
One value we’ll also need is how much noise are you willing to have? As in, how much additional noise in your final sub exposure are you happy with? Of course we want as little noise as can be, but the less noise we’re happy with, the longer our exposure. And I’ve already discussed why this may not be the best idea going.
This value is what we call ‘C’. It’s quite a nasty formula to calculate
If you want, then here’s the sums! If you’re not fond of the mathematics, then you can jump to a cheat sheet I’m including.
Where E is our tolerated noise as a percentage. For example if I’m happy with 10% noise in my image, then E=10
Firstly, do the sums in the brackets
Next up, square the result from the brackets and then subtract 1
Then finally divide that number by 1
If that isn’t for you, then here’s a simplified cheat sheet that has already been calculated for you and rounded up to easier to use numbers.
| Tolerated Noise Amount (%) | ‘C’ Value |
| 1 | 50 |
| 2 | 25 |
| 5 | 10 |
| 10 | 5 |
| 15 | 3 |
| 120 | 2.3 |
| 25 | 1.8 |
Okay let’s go back to that formula.
Bring It All Together
- ‘C‘ is our tolerated noise as calculated above’: I’m going to use 10%, so C = 5
- ‘R‘ is the read noise of our camera, at a gain of 150, my read noise is 4
- ‘P‘ is our Light Pollution Rate (Sky Electron Rate) which is 1.92
Here’s our sum!
First I’m going to square my read noise
Next, divide I’ll that by the sky electron rate
Finally I have to multiple my noise tolerance by this number
This means my optimum sub exposure is 42 seconds.
What About Filters?
I hear you asking now “what about filters?”. Well, once you’ve got your head around the initial calculation, our filtration will of course affect our exposure time as well. Even light pollution suppression filters will increase this time and all the way up to super narrowband filters.
To calculate this, I’ll take my optimum sub-exposure I just calculated of 42 seconds. Next up, I’ll look at this fancy cheat sheet and compare it to what filter I’m using. I then multiply my optimum exposure by the affect the filter has. Again, this is not at all exhaustive at all.
Filter Affect On Sub-Exposure Length
| Filter Bandpass | Multiplication |
| 3nm | x 100 |
| 6nm | x 75 |
| 9nm | x 50 |
| 12nm | x 25 |
| Light Pollution Suppression Filter | x 3 |
| No Filter (you can ignore this) | x 1 |
So let’s say I’m using a light pollution filter, I’ll take my 42 second exposure and then multiply that by 3. That means my new optimum exposure is 125 seconds.
Or I’m using a 6nm Hydrogen Alpha filter? Then I’ll multiply it by 75. Therefore my optimum exposure is 3125 seconds. Okay that’s almost an hour which is totally impractical. If I was using a mono camera then that would still be almost 17 minutes. I really would need to look into changing my camera settings like my gain. Or again, I may just need to half that and take twice as many sub-exposures to make it manageable. This will make more sense when I talk about stacking.
Hopefully this has made some sense! If you’re more a visual learner, then please find the video lnked below to my YouTube channel where I’ll explain it there.
How To Pick An Exposure Time For Astrophotography (Video)
This will be here as soon as the video is done!
Optimum Sub-Exposure For Astrophotography Calculator
So you can do all of that with pen and paper. But I spent a couple of days re-learning coding and created this useful calculator. In it you enter in things like your read noise and pixel size etc, and at the end will be a suggested optimum sub-exposure length for astrophotography.
It is based off of what Robin created, and I put my own swing on it. This is an all-in-one area that will do your light pollution calculation and give you a suggested exposure at the end.
Your read noise can be found and estimated from the charts that the camera manufacturer releases. Though if you want an exact number, I recommend running a sensor analysis in SharpCap.
Remember! This is just a generalisation. I do absolutely promote you to do your own testing as well. Particularly if you’re using strong narrowband filters and it gives you an answer that’s 20 minutes long. Then you may need to split it down further as stacking will help create a better image as well.